100 simulated flights, random start and target ≥2 km apart, random 2–6 m/s wind. Each vision fix is the real exported champion (berlin.onnx) run on a crop of Berlin’s 2024 aerial survey at the aircraft’s true position and heading — a photograph it never saw in training — classified with the frozen scorer’s own thresholds.
Then and now
| previous champion its own training photograph |
current champion a photograph it never saw | |
|---|---|---|
| flights within 100 m | 91/100 | 95/100 |
| median miss at arrival | 45 m | 47 m |
| worst flight | 7,362 m | 212 m |
| false fixes, all 100 flights | 207 in 50 flights | 59 in 34 flights |
| fixes lost off the mapped box | 77 | 0 |
| corner-to-corner showcase: landed / false fixes / worst belief error | 25.5 m / 7 / 5.5 km | 40 m / 2 / 2.3 km |
Same 100 routes, seeds and wind. The previous champion (berlin-slim experiment 5, 0.040) was flown over the very photograph it had memorized; on any other photograph of Berlin it scores 1.87, as good as guessing. The current champion (capture-holdout experiment 20, 0.078) is flown over the held-out 2024 survey, the harder test. It lands about as close (median 47 m against 45 m), but far more flights arrive, nothing is lost off the map, and it makes under a third of the false fixes.
Berlin Spree corridor mission, camera only, GPS-denied
Along the Spree over a photograph the model never saw — 7.5 km in 9 minutes, 5 false fixes at 2 places, finished 47 m from the end.
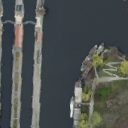 —
Bottom camera — what the model saw
—
128 × 128 px · 1 m/px · ~100 m AGL
The estimate against the truth
How far the navigator's belief is from the aircraft's true position, second by second.
Between fixes the error grows — wind the navigator cannot see. Each usable fix snaps it back down. The spikes are the false fixes: t = 237–249 s at the Spreebogen beside the Chancellery; t = 435–471 s at the Charlottenburg bend. The navigator moves most of the way toward every confident answer, so a false fix drags the belief in proportion to how wrong it is. The river’s are 113–388 m off, so the belief never strays more than 328 m, and the next usable fix pulls it back. On the corner-to-corner A → B showcase (first menu) a single barely-confident answer 2.3 km off pulled the belief 2.3 km away: that is why the mission score prices false fixes so high. Square-root vertical scale, so the cruise detail and the spikes fit one axis; the dashed line is the 100 m usable radius. The chart follows whichever flight the replay is showing.
A hundred flights
Every Monte-Carlo flight's miss distance — arrivals and near-misses, no catastrophes.
Each dot is one flight’s true distance from target at the moment it declared arrival (hollow = timed out, plotted at final distance). 95 land inside the 100 m line. The other 5 miss moderately (102–212 m), and none is lost: no flight left the mapped box, none timed out. (The previous champion had three catastrophes of 2–7 km.) 24 of the 59 false fixes stand on the never-trained holdout ground, the ~3% of Berlin the evaluation harness deliberately withholds from training as a diagnostic. Excluding it, the in-flight false-fix rate is 0.74%, consistent with the 0.75% the frozen eval measures on the same photograph. A deployed model would train on 100% of its box, so the holdout share is an artifact of simulating over the research configuration — reported as flown, not filtered out.
| flight | ended | true miss | false fixes | target on never-trained ground |
|---|---|---|---|---|
| 5 | declared arrival | 102 m | 1 (1 on never-trained ground) | |
| 9 | declared arrival | 110 m | 4 (4 on never-trained ground) | |
| 6 | declared arrival | 145 m | 4 (2 on never-trained ground) | yes |
| 70 | declared arrival | 150 m | 0 | yes |
| 75 | declared arrival | 212 m | 3 |
Six more missions
Return home, a tour, a loiter, a survey, a cold start and the river: the same aircraft and model, asked different questions.
A → B asks one thing. Real flights ask more: come back, hold a spot, sweep an area, start without knowing where you are. Each mission below was flown 40 times with the same airframe, wind, navigator and model as above, over the same 2024 photograph, and once more without the camera in the very same weather. Pick one in the replay’s first menu, or use the buttons to watch a success and a failure.
| mission | succeeds | without camera |
fixes false | measured | replay |
|---|---|---|---|---|---|
| Return home Fly 2+ km out to B, then back to the launch point: the lost-link failsafe. Home has to be found again from the opposite heading. success = B and home both within 100 m | 88% | 0% | 1.0% | home reached within 100 m on 39 of 40 flights, median 42 m | |
| Waypoint tour Four spots in a row, 1–3 km apart. Does the error build up from leg to leg? success = all four spots within 100 m | 55% | 0% | 1.4% | median miss per spot 68 / 56 / 54 / 56 m: no build-up | |
| Loiter Orbit one spot at 150 m radius for five minutes: the same ground from every heading, where one false fix pulls the aircraft off station. success = ≥95% of the orbit within 100 m of the circle | 90% | 0% | 1.2% | median 100% of the orbit on station; worst flight 88% | |
| Survey grid Six 1.2 km lines, 200 m apart, at a random angle: the aircraft has to hold each line, not just reach its end. success = ≥95% of the grid lines flown within 100 m | 75% | 10% | 1.1% | median cross-track 34 m | |
| Cold start The aircraft does not know where it is: it believes it sits at the centre of the map and circles until the first confident fix. success = arrives within 100 m | 98% | 0% | 1.1% | located itself on its first frame (median flight); 3 flights began from a false fix and recovered | |
| Spree corridor 7.5 km along the river through the centre, both directions: long stretches of water and embankment that look alike. success = ≥95% of the river flown within 100 m | 50% | 0% | 3.5% | median cross-track 40 m |
The error does not build up. On the tour the median miss is the same at the fourth spot as at the first; every usable fix resets the estimate. Of the 58 failed mission flights, 51 took at least one confident wrong answer that dragged the believed position away; the other 7 had none and missed narrowly (100–167 m against the 100 m limit). A longer mission simply draws more wrong answers, which is why the four-spot tour succeeds on 55% of flights while each of its spots is reached on 84% of visits.
False fixes belong to places, not to chance. Along the Spree 3.5% of fixes are false, against 1.0%–1.4% on the other missions, and every one of the 40 flights had at least one. But 126 of the 128 sit in two kilometres of river: the Spreebogen beside the Chancellery (18% of fixes there false) and the Charlottenburg bend (7% of fixes there false). The other kilometres run at 0.0%–0.4%. The same model flying the same river fails at the same spots, so this is a property of the map, measurable before anyone flies, and the kind of weakness a training experiment can target.
What is real here, and what is simulated
The test is honest only if its seams are visible.
Real
- The model: the exported champion berlin.onnx (capture-holdout experiment 20, mission score 0.078), unmodified.
- The camera: a 128 × 128 m crop of Berlin’s 2024 aerial survey at the aircraft’s true position and true heading — a photograph the model never saw in training, the same held-out condition the frozen eval measures.
- The thresholds: confidence gate and the 100 m usable radius imported from the frozen scorer, not re-chosen.
- The fix schedule: every 6 s in cruise, 2 s on approach — the deployment spec’s own numbers.
Simulated
- The airframe: point-mass fixed-wing, 16 m/s, bank-limited turns — kinematics, not aerodynamics.
- The disturbances: constant wind 2–6 m/s + gusts, gyro bias, airspeed error — all invisible to the navigator.
- The navigator: dead reckoning + magnetometer heading (standard FC hardware; vision stays the only position source), fixes blended by staleness. False fixes are accepted like any other.
- The mission logic: written for this simulator in the manner of ArduPlane, not ArduPilot’s code: a waypoint counts as passed once the aircraft crosses the line through it; survey lines and the river are followed as lines; the orbit is a guidance field; a cold-started aircraft circles until its first confident fix.
Best-case caveats
- The camera is a different aerial survey than the training ones, not a real UAV camera: no lens distortion, motion blur, night or sensor noise. It tests a photograph the model never saw, not sim-to-real transfer.
- Altitude is fixed at the trained 1 m/px scale; tilt and altitude robustness are unmeasured, here as in the eval.
The control
- Same 100 flights with vision disabled: 0 arrive within 100 m, median miss 823 m. Whatever navigation is happening here, it is the model doing it.
- The six other missions, flown again without the camera, succeed on 0%, 0%, 0%, 10%, 0%, 0% of flights (return home, waypoint tour, loiter, survey grid, cold start, spree corridor).
The bottom line
Asked to fly over a photograph it never saw, the champion delivers 95 flights in 100 to within 100 m — with under a third of the false fixes the previous champion made on its own training photograph, and every miss on the page. Across six other missions the error never builds up; what fails a mission is nearly always one confident wrong answer, and those cluster at a few places on the map.